
Article
An Interactive Probability Plotting Program
Journal of Quality Technology
Document Type
Article
Disciplines
Publication Version
Published Version
Publication Date
7-1-1988
DOI
10.1080/00224065.1988.11979107
Abstract
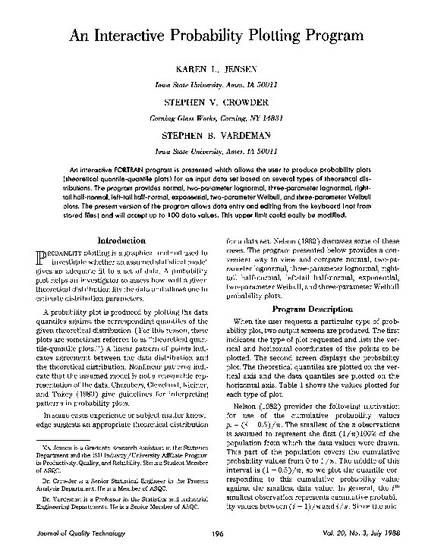
An interactive FORTRAN program is presented which allows the user to produce probability plots (theoretical quantile-quantile plots) for an input data set based on several types of theoretical distributions. The program provides normal, two-parameter lognormal, three-parameter lognormal, right-tail half-normal, left-tail half-normal, exponential, two-parameter Weibull, and three-parameter Weibull plots. The present version of the program allows data entry and editing from the keyboard (not from stored files) and will accept up to 100 data values. This upper limit could easily be modified.
Rights
Reprinted with permission from Journal of Quality Technology (c) 1988 ASQ, www.asq.org
Copyright Owner
ASQ
Copyright Date
1988
Language
en
File Format
application/pdf
Citation Information
Karen L. Jensen, Stephen V. Crowder and Stephen B. Vardeman. "An Interactive Probability Plotting Program" Journal of Quality Technology Vol. 20 Iss. 3 (1988) p. 196 - 210 Available at: http://works.bepress.com/stephen_vardeman/35/
This article is published as Jensen, Karen L., Stephen V. Crowder, and Stephen B. Vardeman. "An interactive probability plotting program." Journal of Quality Technology 20, no. 3 (1988): 196-210. DOI: 10.1080/00224065.1988.11979107.