
Article
Interactive Visualization of GRT and BioHTS Data
Computer Science and Engineering Faculty Publications
Document Type
Presentation
Publication Date
1-1-2014
Disciplines
Abstract
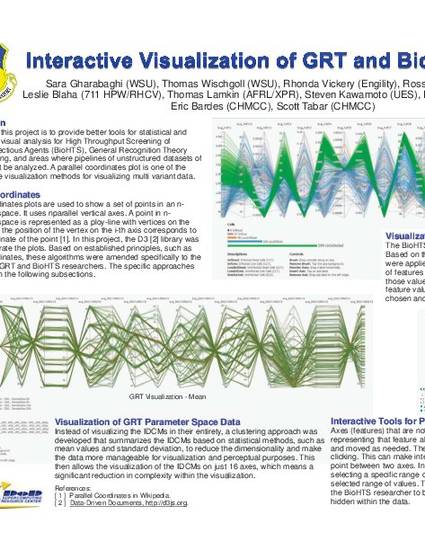
The scope of this project is to provide better tools for statistical and informational visual analysis for High Throughput Screening of Biological Infectious Agents (BioHTS), General Recognition Theory (GRT) modeling, and areas where pipelines of unstructured datasets of all types must be analyzed. A parallel coordinates plot is one of the more effective visualization methods for visualizing multi variant data.
Citation Information
Sara Gharabaghi, Thomas Wischgoll, Rhonda J. Vickery, Ross Smith, et al.. "Interactive Visualization of GRT and BioHTS Data" (2014) Available at: http://works.bepress.com/thomas_wischgoll/33/
Presented at the AFRL/AFIT Human-Machine Systems Colloquium, Dayton, OH, 2014.