
Presentation
Data Visualization & Why it is Important to Get it Right: Tools You Can Use
Faculty Scholarship and Creative Works
Keywords
- data visualization,
- intro to data visualization,
- why we visualize data,
- what are data visualization tools,
- what are data visualization software,
- STELLA(!) Unconference
Abstract
This was presented at STELLA (Science, Technology, and Engineering Library Leaders in Action) Unconference 2020 for their Lightning Round session on Friday, October 9, 2020. The presentation abstract is below:
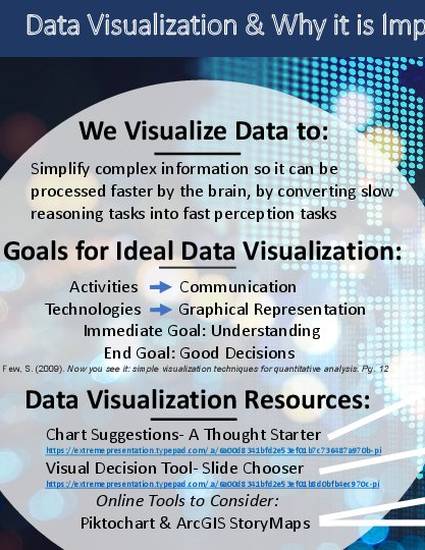
Have you ever asked yourself why spending the time to visualize your data findings is important and where to start when looking for data visualization tools? How about wondering what kind of chart or slide might make a more compelling visualization to showcase your data? In this informative lightning round session, useful tools and resources will be shared along with why it is important to get it right. Don’t be left out in the dark about easy and quick ways to make the most out of your next data visualization project.
Publication Date
10-9-2020
Document Type
Conference Presentation
Copyright Status
Author retained
Publication Version
Author's version
Rights
Creative Commons Attribution 3.0
Disciplines
College
Information Technologies & Resources
Location
Orlando (Main) Campus
Department
UCF Libraries
Citation Information
Sandy Avila. "Data Visualization & Why it is Important to Get it Right: Tools You Can Use" (2020) Available at: http://works.bepress.com/sandy-avila/44/