Other
Similarity and Convergence (S-C) plot
(2006)
Abstract
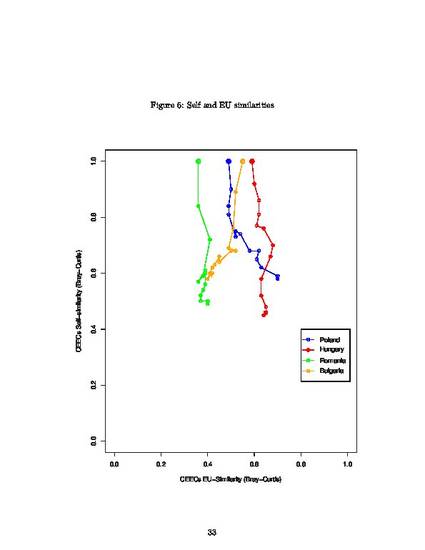
This is figure 5 from the paper Economic integration and similarity in trade structures with Lucia Tajoli. We called it S-C plot, Similarity and Convergence plot. It shows on the vertical axis the level of self-similarity (with respect to a self reference level, in our case the trade composition in the initial year of the time series) and on the horizontal axis the level of convergence with the benchmark case (in our case the contemporaneous trade composition of the EU15). South-East movements mean a change in self-similarity and a convergence toward the EU15 trade composition. R code will follow.
Keywords
- Convergence plot
Disciplines
Publication Date
Summer July 25, 2006
Citation Information
Luca De Benedictis. "Similarity and Convergence (S-C) plot" (2006) Available at: http://works.bepress.com/luca_de_benedictis/29/
