
Other
Univariate Distribution Relationships Interactive Chart
(2021)
Abstract
A univariate probability distribution is used to assign a probability to various outcomes of a random experiment. A random experiment is one whose outcome can not be predicted with certainty prior to conducting the experiment. When the set of all possible outcomes to a random experiment is countable or a countable infinity, the probability distribution can be described by a probability mass function and the associated random variable is discrete. Otherwise, the probability distribution can be described by a probability density function and the associated random variable is continuous. A mix of these two cases is known as a mixed discrete-continuous distribution.
A univariate probability distribution is the probability distribution of a single random variable. This is in contrast to a bivariate or multivariate probability distribution, which defines the probability distribution of two or more random variables.
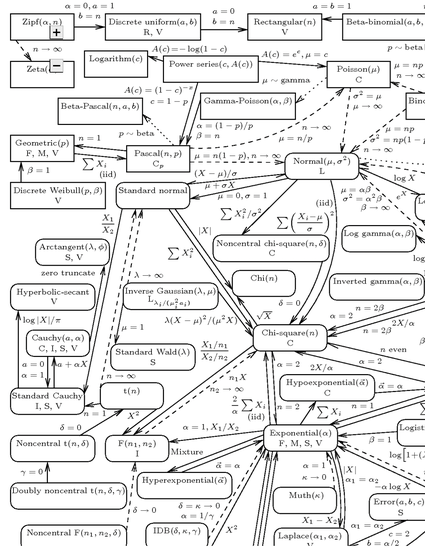
The list on the left-hand side displays the names of the 76 probability distributions (19 discrete distributions given by the rectangular boxes and 57 continuous distributions given by the rectangular boxes with the rounded corners) present in the chart. Hovering your mouse over the name of a distribution highlights the distribution on the chart, along with its related distributions. Depending on the size of your browser window, you might have to adjust the display to find the distribution you are looking for. You may scroll the chart window or zoom in and out with the + and - buttons as needed.
Each distribution on the chart, when clicked, links to a document showing detailed information about the distribution, including alternate functional forms of the distribution and the distribution's mean, variance, skewness, and kurtosis.
The main developers were Lawrence Leemis, Daniel Luckett, Austin Powell, Jackie Taber, and Peter Vermeer (all from the COR (Computational Operations Research) program at The College of William & Mary). Other contributors are: Tim Adams, Stefano Bettelli, Ruben Becerril Borja, Hans Brunner, Ryan Carpenter, Erin Catlett, Danny Cogut, Chad Conrad, Laura Decena, Evan Elsaesser, Luke Godwin--Jones, Matt Goldman, Matt Hanson, Yan Hao, Billy Kaczynski, Andrew Mashchak, Maximilian Matthe, James McCormack, Lee McDaniel, Lauren Merrill, Erik Olsen, Scott Percic, Jean Peyhardi, Robin Ryder, Evan Saltzman, Christian Schröder, Erich Schubert, Witold Siedlaczek, Maciej Swat, Chris Thoma, Melissa Tilashalski, Erik Vargo, Chris Weld, Jeff Yang, Vincent Yannello, Hang Yu, and Andrei Zorine. Support also came from the National Science Foundation.
Keywords
- Probability,
- Mathematics,
- Univariate Probability Distribution,
- Random Experiment
Disciplines
Publication Date
2021
Citation Information
Lawrence Leemis. "Univariate Distribution Relationships Interactive Chart" (2021) Available at: http://works.bepress.com/lawrence-leemis/29/