
Article
Data Note: State Intellectual and Developmental Disability Agencies’ Service Trends
ThinkWork! Publications
Document Type
Occasional Paper
Publication Date
1-1-2018
Keywords
- Intellectual and Developmental Disabilities,
- I/DD,
- Developmental Disabilities,
- Employment,
- Access to Integrated Employment,
- ThinkWork,
- 90DN0295
Disciplines
Abstract
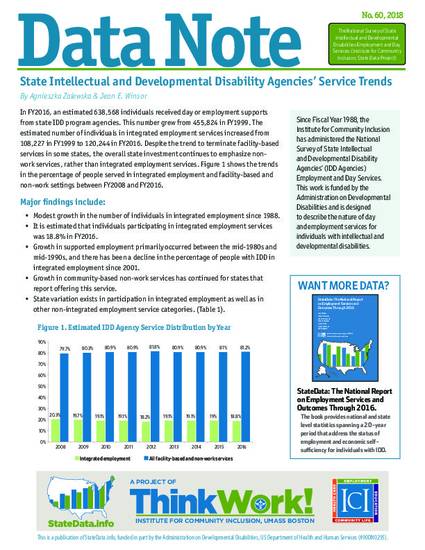
In FY2016, an estimated 638,568 individuals received day or employment supports from state IDD program agencies. This number grew from 455,824 in FY1999. The estimated number of individuals in integrated employment services increased from 108,227 in FY1999 to 120,244 in FY2016. Despite the trend to terminate facility-based services in some states, the overall state investment continues to emphasize non-work services, rather than integrated employment services. Figure 1 shows the trends in the percentage of people served in integrated employment and facility-based and non-work settings between FY2008 and FY2016.
Community Engaged/Serving
No, this is not community-engaged.
Citation Information
Zalewska, A., and Winsor, J.E. (2018). State Intellectual and Developmental Disability Agencies’ Service Trends. DataNote Series, Data Note 60. Boston, MA: University of Massachusetts Boston, Institute for Community Inclusion.