
Article
Visualizing protein data sets in R through a student peer-review rubric
Biochemistry and Molecular Biology Education
(2022)
Abstract
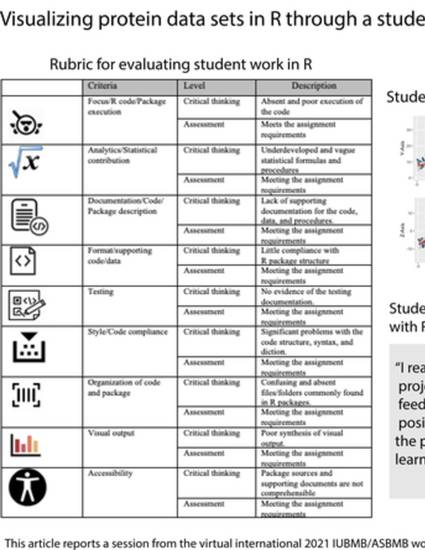
The R programming language and computing environment is a powerful and common platform used by life science researchers and educators for the analysis of big data. One of the benefits of using R in this context is its ability to visualize the results. Using R to generate visualizations has gained in popularity due to the increased number of R packages available to convert data to graphic display. In this paper, I ask the following question: how can student engagement with protein analysis be promoted using R-based visualizations in the classroom? During the 2021 IUBMB/ASBMD workshop “Teaching Science with Big Data”, I presented a teaching strategy that used R for the visualization of protein data. In this report, I provide a teaching procedure and a summary of how students engaged with these data in our Introduction to R for Professional Data Science class. This report is based on a case study methodology by reviewing student peer comments for protein analyses conducted in R. The results indicated that students were active participants in the peer-review process and that they learned to take a critical view of data visualization.
Keywords
- big data,
- open source R,
- rubric,
- student peer review
Disciplines
Publication Date
Summer July 15, 2022
DOI
doi.org/10.1002/bmb.21648
Citation Information
Friedman, A. Visualizing protein data sets in R through a student peer-review rubric. Biochem Mol Biol Educ. 2022. https://doi.org/10.1002/bmb.21648
Creative Commons license

This work is licensed under a Creative Commons CC_BY International License.