
Article
Multi-Focus and Multi-Level Techniques for Visualization and Analysis of Networks with Thematic Data
Proc. of Visualization and Data Analysis (VDA 2013)
(2013)
Abstract
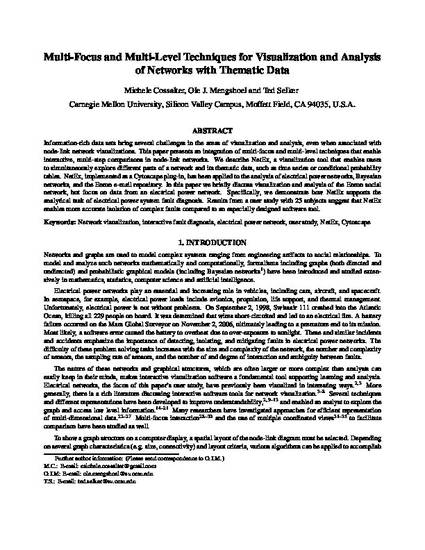
Information-rich data sets bring several challenges in the areas of visualization and analysis, even when associated with node-link network visualizations. This paper presents an integration of multi-focus and multi-level techniques that enable interactive, multi-step comparisons in node-link networks. We describe NetEx, a visualization tool that enables users to simultaneously explore different parts of a network and its thematic data, such as time series or conditional probability tables. NetEx, implemented as a Cytoscape plug-in, has been applied to the analysis of electrical power networks, Bayesian networks, and the Enron e-mail repository. In this paper we briefly discuss visualization and analysis of the Enron social network, but focus on data from an electrical power network. Specifically, we demonstrate how NetEx supports the analytical task of electrical power system fault diagnosis. Results from a user study with 25 subjects suggest that NetEx enables more accurate isolation of complex faults compared to an especially designed software tool.
Keywords
- Network visualization,
- interactive fault diagnosis,
- electrical power network,
- user study,
- NetEx,
- Cytoscape
Disciplines
Publication Date
February, 2013
Publisher Statement
@inproceedings{cossalter13multi,
author = {Cossalter, M. and Mengshoel, O. J. and Selker, T.},
title = {Multi-Focus and Multi-Level Techniques for Visualization and Analysis of Networks with Thematic Data},
booktitle = {Proc. of Visualization and Data Analysis (VDA-13)},
year = {2013},
month = {February}
}
Citation Information
Michele Cossalter, Ole J Mengshoel and Ted Selker. "Multi-Focus and Multi-Level Techniques for Visualization and Analysis of Networks with Thematic Data" Proc. of Visualization and Data Analysis (VDA 2013) (2013) Available at: http://works.bepress.com/ole_mengshoel/39/