
Other
African choropleth maps
(2011)
Abstract
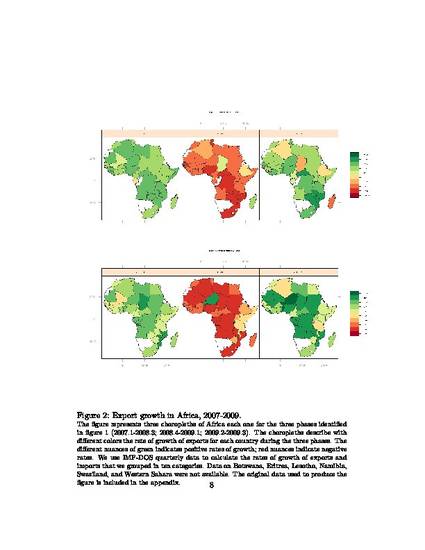
The figure represents three choropleths of Africa (2007.1-2008.3; 2008.4-2009.1; 2009.2-2009.3) describing with different colors the rate of growth of exports and imports for each country during the three phases. The different nuances of green indicates positive rates of growth; red nuances indicate negative rates. R code will follow.
Keywords
- Choropleth maps
Disciplines
Publication Date
Spring February 1, 2011
Citation Information
Luca De Benedictis. "African choropleth maps" (2011) Available at: http://works.bepress.com/luca_de_benedictis/26/