
Presentation
The visualization of database search results
2011 ASEE Annual Conference and Exposition: Your Passport to Engineering Education
(2011)
Abstract
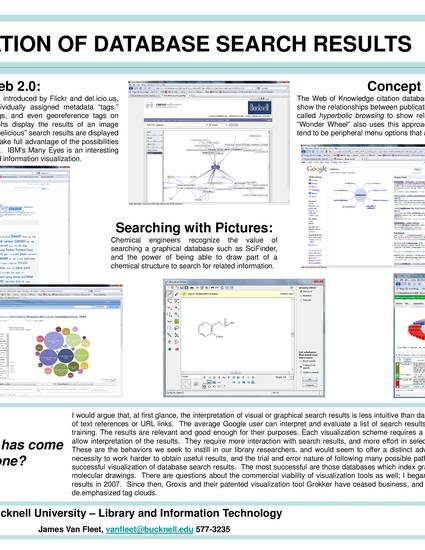
Introduction: Edward Tufte describes the visual presentation of quantitative data as “envisioning information.” A number of databases, from Google to specialized subject databases, offer a graphical representation of research results. Visualization is offered as an alternative method for evaluating search results. This trend deserves closer scrutiny, since the question of how database users evaluate their search results is central to the success of their library research.
Disciplines
Publication Date
January 1, 2011
Citation Information
James A. Van Fleet. "The visualization of database search results" 2011 ASEE Annual Conference and Exposition: Your Passport to Engineering Education (2011) Available at: http://works.bepress.com/james_vanfleet/18/